Gaps #93952
openMIS Report: generate the percentage of resistant isolates for selected organisms and antibiotics within a specified period.
0%
Description
Description: To generate the percentage of resistant isolates for selected organisms and antibiotics within a specified period.
Step to reproduce:
1. Login to Medcare
2. Navigate to MIS Report> Lab Report> List of Reports
3. Create new report tittle: Resistance Pattern Report
4. The system shall provide search filters for Date Range, Unit, Ward, Specimen Type, Source Type, and Organism. Users may select a single organism, multiple organisms, or all organisms before generating the Resistance Pattern Report.
| Field | Control Type | Mandatory |
| From Date | Date Picker | Yes |
| To Date | Date Picker | Yes |
| Unit | Dropdown | Optional |
| Ward | Dropdown | Optional |
| Specimen Type | Multi Select (Searchable) | Optional |
| Source Type | Multi Select (Searchable) | Optional |
| Organism | Single/ Multi Select/ All (Searchable) | Optional |
*Note: User may select single / multiple or all organisms.
5. Based on the formula given below, generate the report
Formula:
Resistance % = (Number of Resistant Isolates / Total Isolates Tested) × 100
Where:
1. Total Isolates Tested = Total number of susceptibility results recorded for the same Organism and Antibiotic combination within the selected filters.
2. Number of Resistant Isolates = Total number of results with Interpretation = 'R' (Resistant).
Conditions:
1. Retrieve all antibiotics used within selected date range.
2. The report shall display the following information:
Organism
Antibiotic
Total Tested
Resistant Count
Resistance Percentage (%)
3. The system shall automatically determine the antibiotics tested for the selected organism(s). No antibiotic selection is required on the search screen.
Sample Expected Report layout is shown below:
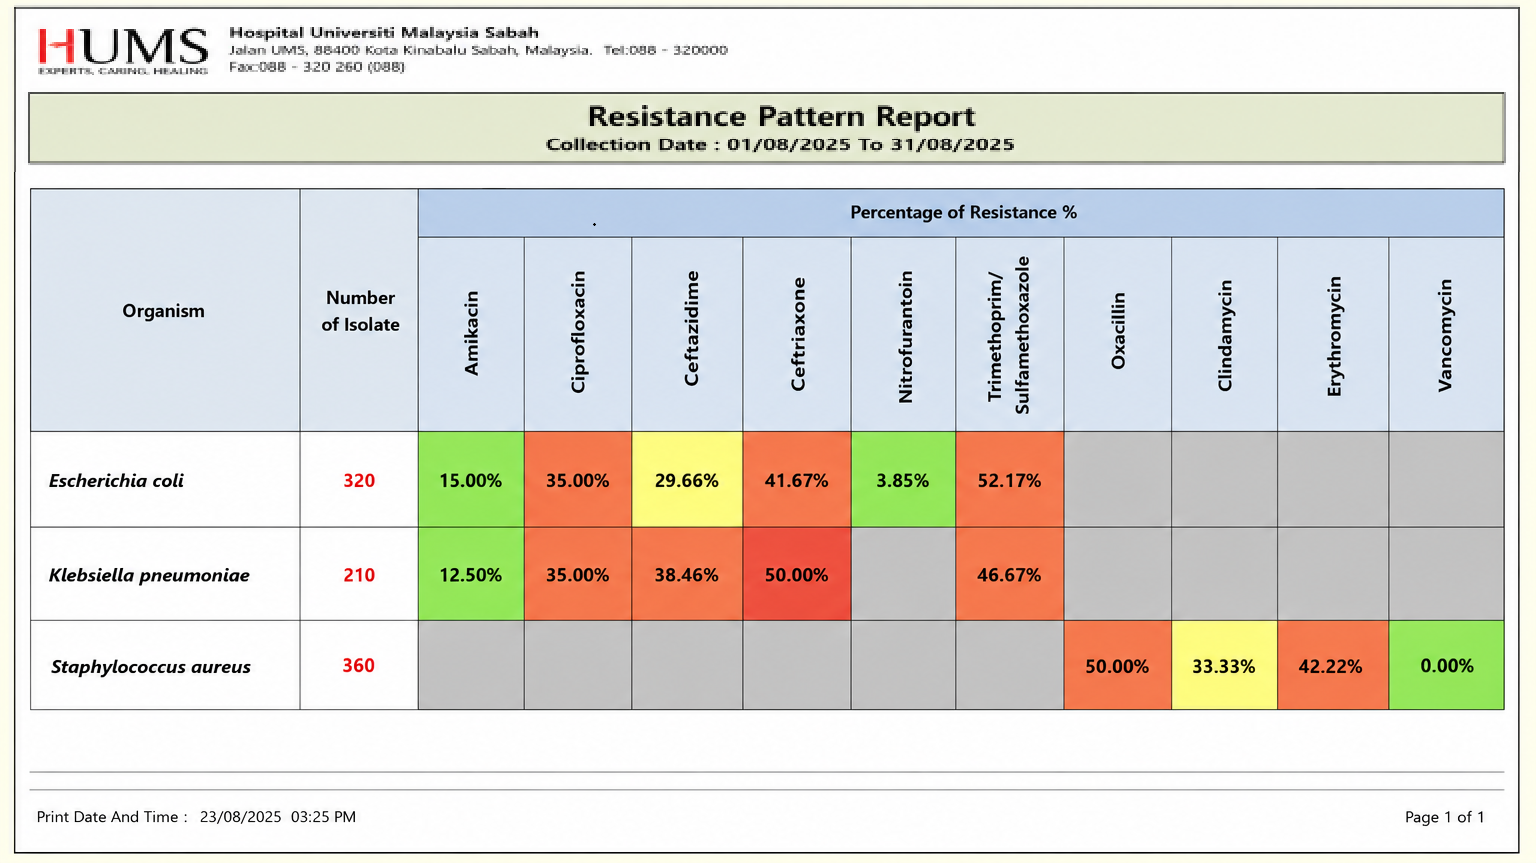
Notes:
1. Color coding shall be applied consistently across all organisms and antibiotics in the report.
2. Grey cells indicate that the organism was not tested against the corresponding antibiotic or no result is available within the selected criteria.
3. The report shall include a legend at the bottom indicating the meaning of each color.
Example Legend:
Green Color : Low Resistance (0–19.99%)
Yellow Color : Moderate Resistance (20–39.99%)
Orange Color : High Resistance (40–59.99%)
Red Color : Very High Resistance (≥60%)
Grey Color : No Data / Not Tested
Files